|
Abstract Measuring
functional activity in brain (,,, in connection with neural
stimulation faces technological challenges. Our goal is to
evaluate, in relative terms, the real-time variations of local
cerebral blood flow in rat brain (,,,, with a convenient spatial
resolution. The use of laser Doppler flowmetry (LDF) probes is a
promising approach but commercially available LDF probes are
still too large (450 lm) to allow insertion in brain (,,, tissue
without causing damage in an extension that may negatively
impact local measurements. The self-mixing technique coupled to LDF is herein proposed to overcome limitations of the minimal
diameter of the probe imposed by non-self-mixing probes
(commercial available probes). Our Monte Carlo simulations show
that laser photons have a mean penetration depth of 0.15 mm, on
the rat brain (,,, with the 785 nm laser light microprobe. Moreover,
three self-mixing signal processing methods are tested: counting
method, autocorrelation method, power spectrum method. The
perfusion signal computed shows a good linearity with the scatterers velocity, for the three methods (a determination
coefficient close to one is obtained), for the in vitro
measurements.Furthermore, we believe that these indicators can
be used to monitor local blood flow changes in the rat brain
(,,,.
Keywords
Self-mixing Laser Doppler flowmetry Blood flow
Microcirculation
1 Introduction
1.1 Basic principles and measuring system Laser Doppler
flowmetry (LDF) is a technique to monitor microvascular
(,,,.blood
perfusion in real time. The principles of this technique
encompass the use of a coherent laser light beam carried from a
laser unit by an emitting optical fibre to the tissues under
study [2, 6]. The light is then reflected, scattered, absorbed
or transmitted in the tissues. When photons hit moving red blood
cells (RBCs), a change in their wavelength occurs (Doppler
shift), conversely to the photons that hit static structures
that do not have any modification in their wavelength [2, 6].
This technique eliminates the need of additional detectors and
components such as isolators and pinholes. This leads to cheaper
and more compact systems [20].
1.2 Brain (,,,microcirculation and motivation Brain requires a
continuous vascular supply of glucose and oxygen to sustain a
proper function, given that neurons lack substrate storage, high
metabolic rate(,,, and high sensitivity to oxygen deprivation.
Furthermore, the supply of blood flow-carrying substrates must
be locally and dynamically regulated to meet the energetic
demand associated with the
increase of the neuronal activity. The existence of mechanisms
that incorporate variations in neuronal activity with local
blood supply was firstly suggested more than a century ago but
they are still not fully clarified. This is a critical process
for brain(,,, structural and functional integrity [7].In
microcirculatory (,,,. brain blood flow measurements, LDF is primarily
considered a non-invasive technique mainly used in studies of
hemodynamic events in cortical surfaces [4, 14]. The available
commercial LDF probes are based on the traditional detection
method where two optical fibres (an emitting and a receiving
fibres) are needed, restricting the minimum diameter of the
probes around to c.a. 500 lm. Therefore, the development of
smaller probes, allowing the monitoring of blood flow changes in
deep brain(,,, structures minimising tissue damage and the negative
impact over natural environment, is an important requirement to
better
understand how brain(,,,. controls its own blood supply. Thus, to
monitor blood flow changes in deep brain structures, we propose
to develop a miniaturized LDF probe based on a self-mixing
method [16].In vitro and in vivo validations of the self-mixing
prototype are presented in this paper. Several signal processing
methods were proposed in the literature for self-mixing signals
processing, namely the counting method (CM), the autocorrelation
method (AC) and the power spectrum method (PSM) [19, 20]. These
methods will be evaluated for both in vitro and in vivo
validations. A discussion of the effects of the signal
processing methods on the results is
presented together with a comparison of the results obtained
with the microprobe prototype and with a commercial available
flowmeter.
2 Methods
Self-mixing prototype
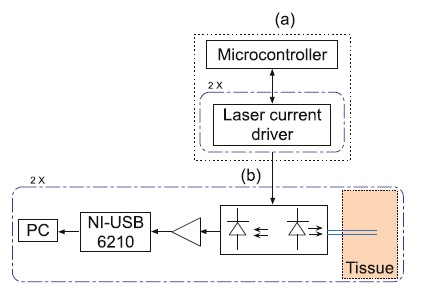
A laser Doppler flowmeter prototype with self-mixing
capabilities, outlined in Fig. 1, is being constructed in our
laboratory and validated for rat brain (,,, invasive measurements
[16]. The prototype is formed by the actuation system,
represented in Fig. 1a, and the self-mixing acquisition system,
represented in Fig. 1b. The actuation system has two constant
current drivers for two different lasers diodes. The acquisition
system is responsible for the self-mixing photocurrent
amplification and the digitalization of the detected signal
through the NI-USB 6210 (National Instruments ). Matlab routines
and subroutines are used for mathematical analyses.

3 Results
Monte Carlo results
The simulations performed for the model shows that the Doppler
shifted photons travelled a mean depth of 0.15 mm in the
hippocampus region. Each photon suffers in average 2.23 scatters
events. In a total of 5,000,000 photons detected, 11.9 % had
suffered Doppler shifts.
In vivo results
The signals collected in the rat brain (,,, were processed and
compared with those obtained with the Perimed probe. All the
above-mentioned signal processing methods were tested. Cerebral
blood flow variations were promoted by systemic injection of
sodium nitrite, which induces a biphasic effect over blood
perfusion: (i) soon after the injection, blood perfusion
slightly increases due to nitriteinduced vasodilatation [24] and
later in consequence of cardiac output rise (to balance the
decreased oxygen transport due to metahemoglobinemia), and (ii)
finally, an abrupt decrease is observed due to cardiac arrest.
Signals were collected from several animals
(,,,(6 measurements with
M1308 and 5 measurements with M785). We only show signals
collected in two of those: one
acquisition was made with the 1308 nm laser light wavelength
(M1308) and the other with the 785 nm laser light wavelength
(M785). Similar results were obtained in the remaining animals.
The Periflux 5000, CM, AM, M0 and M1 results are presented in
Figs. 7 and 8 for M1308 and M785, respectively. In M1308
measurements, three regions can be seen in the signals amplitude
for Periflux 5000, CM, AM and M0 results (see Fig. 7). An
initial baseline can be seen during the first 5 min of
acquisition, followed by an increase in the amplitude and its
oscillations. Finally, the amplitude decreases after 25 min of
acquisition during the cardiac arrest (see Fig. 7). For the M1
results, a pattern that changes in accordance with these three
regions can be seen. The maximal perfusion that occurs after the
nitrite injection was detected at 21.18, 18.22, 19.26 and 22.12
min in Periflux 5000, CM, AM and M0, respectively. The increase
percentage, between the mean baseline value and the peak, was
32.6, 69.45, 74.72, 74.20 % in Periflux 5000, CM, AM
and M0, respectively. In M785, an initial baseline can be seen
during the first 5 min in Periflux 5000, CM, AM and M0 results
(see
Fig. 8). After the nitrite injection, the mean amplitude
decreases in Periflux 5000. This could be due to a
probedisplacement during the nitrite injection.

4 Discussion
The measurement depth obtained in Monte Carlo simulations is in
accordance with the one of Fredriksson et al. [3] where the
authors reported a 0.16 mm of measurement depth. These results
are useful for the rat brain (,,, probepositioning, since the
position of the probe in the specific region of the hippocampus
is conditioned by the mean depth travelled by the Doppler shift
photons. Monte Carlo simulations for 1,308 nm were not
implemented, as optical properties for biological tissues are
published only up to 1,000 nm wavelength. Despite that, for this
wavelength, it is necessary to consider the water present in the
tissue, as the absorption coefficient is high (for 1,300 nm, the
absorption coefficient of water is 1.35 cm-1) when compared with
visible and near infra-red
wavelengths (for 785 nm, the absorption coefficient of water is
0.02398 cm-1) [8]. This implies that, when we
consider the 1,308 nm laser light, most of the light is absorbed
by water, so the incident beam will only penetrate a few cell
diameters into the tissue [15]. In the signals collected in the
rotating turntable, a lower drop of the maximum value of the AM
was used for 785 nm in the phantom measurements: as it can be
seen in Fig. 4b, the autocorrelation functions of different
velocities
for larger lag times mix, loosing the velocity information.
Besides that, the results obtained for 0 mm/s was discarded from
the statistical analysis. As it can be seen in Fig. 4b, the
autocorrelation function for 0 mm/s has a very different shape
when compared with the other velocities. The autocorrelation
function for 0 m/s has a very slow decay time when compared with
the other velocities; however, for the lower lag times it has a
faster decay. The drop threshold was chosen in this fast decay
region. That is why the AM
result for this velocity is out of the range of the results
obtained for the other velocities. Concerning the CM results, a
set of thresholds were tested. The ones with the best results
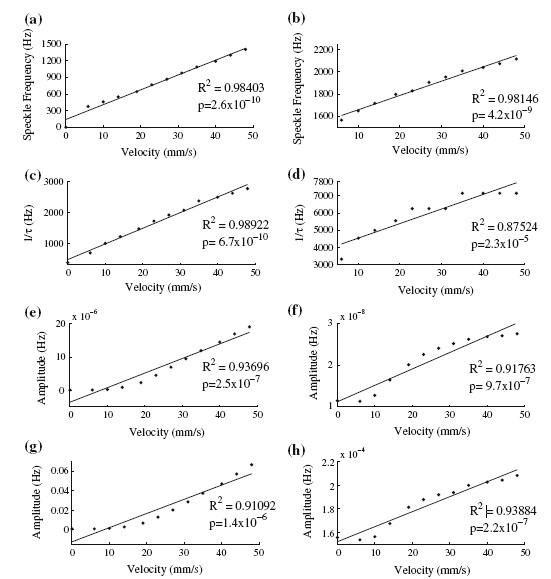
were chosen for in vitro and in vivo validation. In the PSM
results, in the
in vitro tests, a higher low cut-off frequency was chosen (2
kHz) based on the observation of the spectra (Fig. 5) because
for the lower frequencies the spectra are mixed. In vivo results
with the new probes reveal that the microprobesmay
(,,, be used for
rat brain blood flowmonitoring. Blood perfusion variations
promoted by nitrite intraperitoneal injection are clearly
visible on the signals from both tested microprobes: the slight
increment verified after the nitrite injection and the abrupt
decrease observed in consequence
of the cardiac arrest. In M1308 the typical signal obtained with
Periflux 5000 cannot be seen in M1. However,a pattern that
changes in accordance with the three regions can be seen. In
general, signals collected with the microprobe have more
electronic noise, when compared with the Periflux 5000 results.
This indicates that improvements in the self-mixing acquisition
channels must be done, namely the implementation of analogue and
digital filters. For both acquisitions (M1308 and M785), the
peak detected with the new prototype is close to the one
obtained with Periflux 5000. Regarding the increase percentage,
it is higher for the new probes. The smallest increase
percentage obtained with the Perimed device in M785 may be due
to the probe displacement. Parameters used in this work, like
sample frequency, frequency rate(,,, and filters cut-off
frequencies, were based on the ones used in conventional laser
Doppler flowmeters. However, for their validation, more tests
with controlled parameters have to be carried out. Self-mixing
interferometry devices have simple optical systems but
self-mixing phenomena are complex. It is necessary to understand
how the system responds to velocity and concentration of
scatterers in order to use it in perfusion measurements. The
variations of the back-coupled light intensity and its relation
with the perfusion as well as the speckle statistical properties
obtained from microcirculation (,,, blood flow must be understood
[20, 21]. This is crucial to compare selfmixing sensors with the
commercial sensors available.Besides that, the absence of a calibration method is also a
drawback. A proper calibration method could improve the
microprobe response to slight changes in flow and a more clear
differentiation before and after cardiac arrest could be
reached. We present a novel miniaturized LDF probe based on a
self-mixing method to monitor blood flow changes in deep brain
(,,,structures.
References
1. Bonner R, Nossal R (1981) Model for laser Doppler
measurements of blood flow in tissue. Appl Opt 20:2097¨C2107
2. Fredriksson I, Fors C, Johansson J (2007) Laser Doppler
flowmetry¡ª a theoretical framework. http://www.imt.liu.se/bit/ldf/
ldfmain.html¡¡ect
|